
Energy
Kilowatts, on the same floor as the door.
Energy is a signal in kW, not a monthly bill photographed into a folder. Dashboards have an Energy tab beside Overview, Production and Sensors. A line that is stopped while it is still drawing power shows up as an alert, not as a surprise on the KPLC invoice.
Where the number sits
The floor shows temperature, humidity, door open or closed, process temperature, tank level, weight, a water meter, energy in kW, vibration in mm/s, and machine state: running, idle, stopped, fault, maintenance or offline. On the Floor of the demo plant, energy warnings sit in the priority queue next to a vibration alarm: the main processing machine stopped, and it was still drawing power. That is the sentence a shift lead needs at 6am.
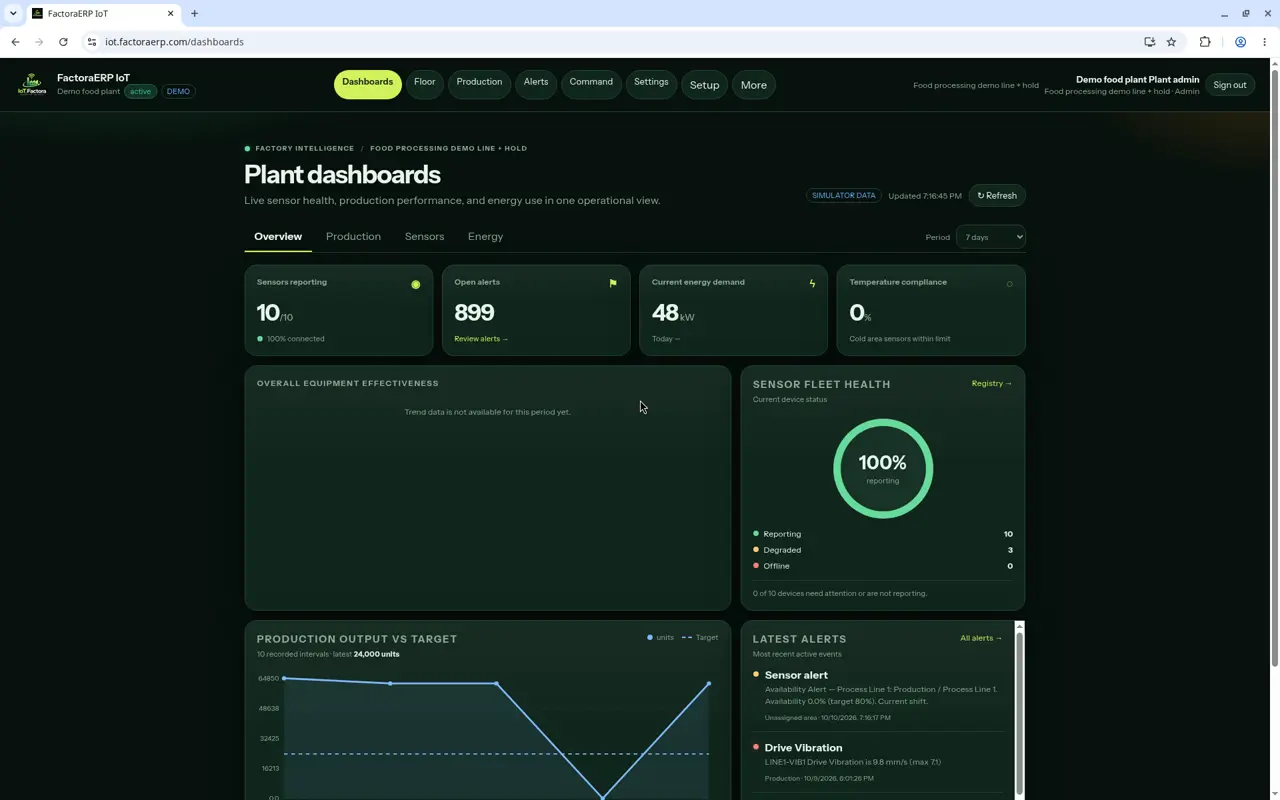
Dashboards split into Overview, Production, Sensors and Energy. The capture beside this column is the Overview tab of the Demo food plant, with the period control on 7 days and the data labelled simulator. The Energy tab is the same plant, one tab over. Current demand in the demo overview is shown in kW.
On the batch
Spoilage, energy and downtime land on the batch in finance, in the same record as the lot. Energy that belongs to a lot should not live in a workbook next to the batch. Copilot can be asked from the same plant data. Answers use this plant's production, downtime, energy, maintenance, and alerts. Advice only.
Book a demo
See it on your plant in 20 minutes
Bring last month’s energy line and one batch that ran through it. We will show the kilowatts next to the run, not in a second login.