
Dashboards
The Monday view, not the 1am view.
At 1am the technician needs the alert and a name. On Monday the manager needs the shape of the week. Dashboards are Overview, Production, Sensors and Energy, with a period control.
The four tabs
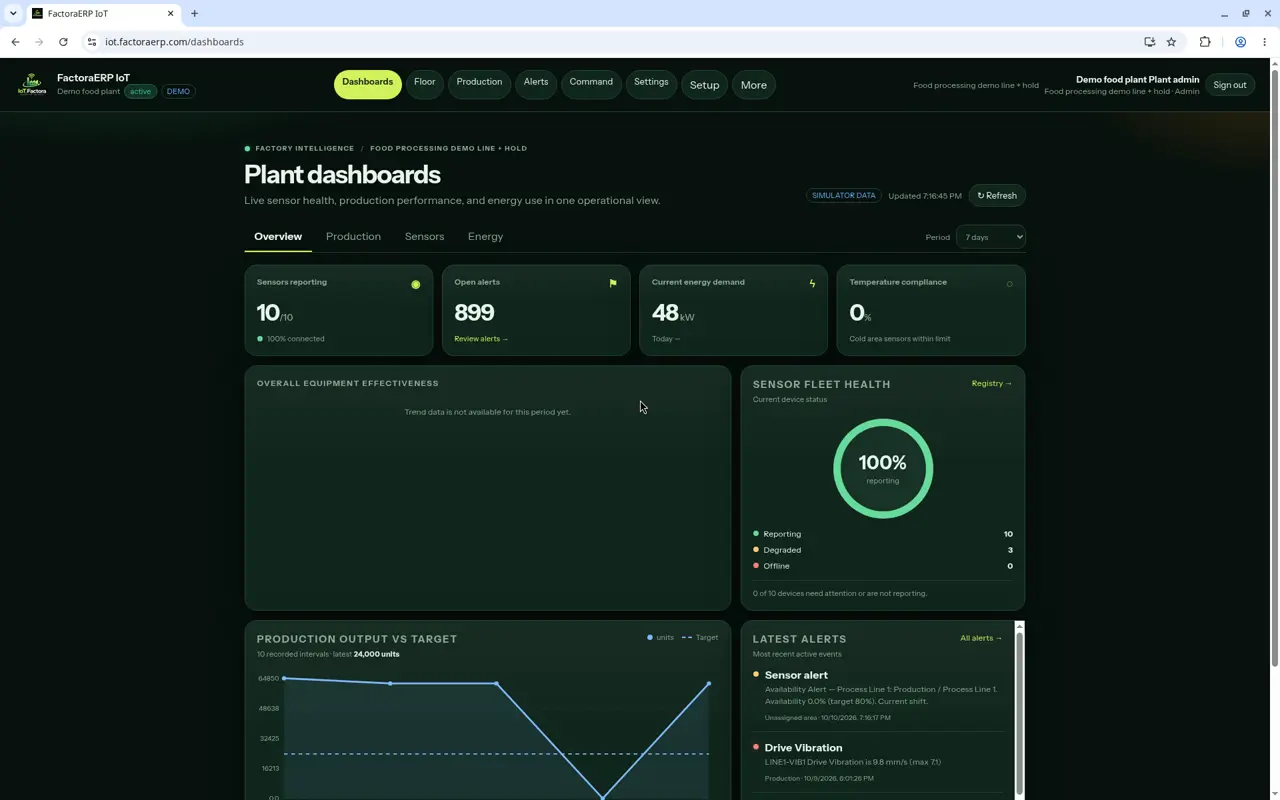
Overview is sensor health, open alerts, energy demand and the production chart. Production, Sensors and Energy are the other tabs. The capture on this page is the Overview tab of the Demo food plant. The corner of that screen says simulator data, and the period control is on 7 days. Those figures are the simulator, not a customer’s week. Demo food plant at iot.factoraerp.com. Telemetry is simulated. Not a customer.
How far back
The period control is how you move through the charts. The demo is showing 7 days. That is not a statement that seven days is the maximum. The audit log is append-only and kept for 365 days. A plant can export it as CSV. Command Center exports CSV as well. A season of readings is an export question, and the export that exists today is CSV from the audit log and from Command Center.
OEE and energy
OEE is its own view, with downtime Pareto and production events on the batch. The Process Line screen in the demo says OEE is not calculated there: it shows planned, produced, good and reject. On the Floor of that same demo, the OEE tile reads N/A. Energy demand is in kW, on the Energy tab and on the floor. Cost of that energy on a specific batch is part of the finance link. The energy page and the production page split those two ideas.
Book a demo
See it on your plant in 20 minutes
Bring the room names and the bands you already run. We will put them on the floor and say which commercial details on this site are still drafts.